Identity salience, social institutions, and emotions expressed about the COVID-19 pandemic on Twitter
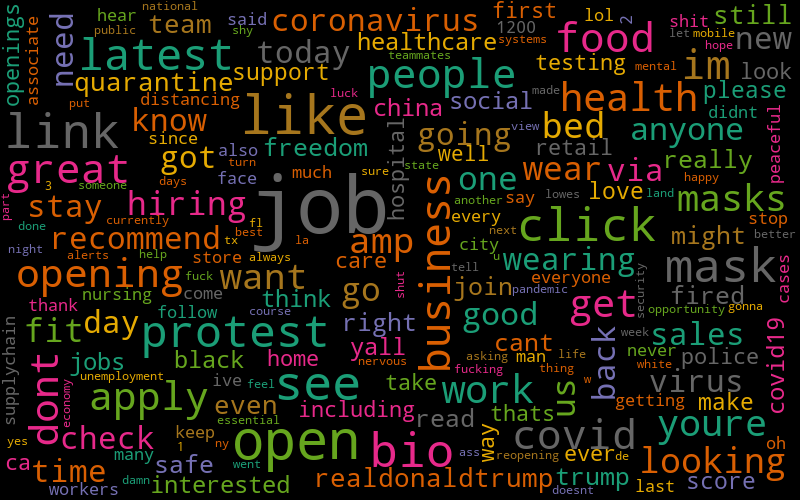
Image depicts word cloud results of geolocated Twitter data on COVID-19 pandemic in June 2020. Using approximately 245 keywords, these findings were identified by the DS3 team during data collection.
Previous research has found emotions expressed during COVID-19 to be negative, such as anxiety, fear, and depression (Boon-Itt et al., 2020; Su et al., 2021). However, some positive emotions (e.g., hope and trust) were associated with future-oriented perceptions of the pandemic (Boon-Itt et al., 2020; Metzler et al., 2022). What is unknown is how these various emotions are impacted by social institutions (i.e., social structures influencing socialization, attitudes, cognition, and behaviors) and identities (i.e., internalized meanings of roles; Brenner, Serpe, & Stryker 2014; Stryker, 1968).
As such, we ask the following: 1) How are emotions about Covid-19 connected to social institutions and social identity?; 2) How does identity salience affect emotions expressed about the COVID-19 pandemic? We drew a random sample of 3,000 tweets from the COVID-19 Online Prevalence of Emotions in Institutions Database (COPE-ID) to conduct this research. A content analysis revealed that 49.8% of the sample reported emotions when discussing the COVID-19 pandemic. The top three emotions included 1) concern (18.7%), 2) disgust (15.3%), and disappointment (12%). This contrasts to previous findings where anxiety and fear were the most common (Boon-It et al., 2022). The fourth most prevalent emotion was anger (11.7%), and it was often directed toward the government. The top three discussed social institutions included 1) Government (17.8%), 2) Healthcare (15.8%), and 3) Media/news (9.8%). Among those who self-identified, references to parental status (1.4%) or that children were present in the home were mentioned the most frequently, followed by age (1.2%) and political affiliation (1%).

Enter your email address to subscribe to this blog and receive notifications of new posts by email.